PDF Publication Title:
Text from PDF Page: 052
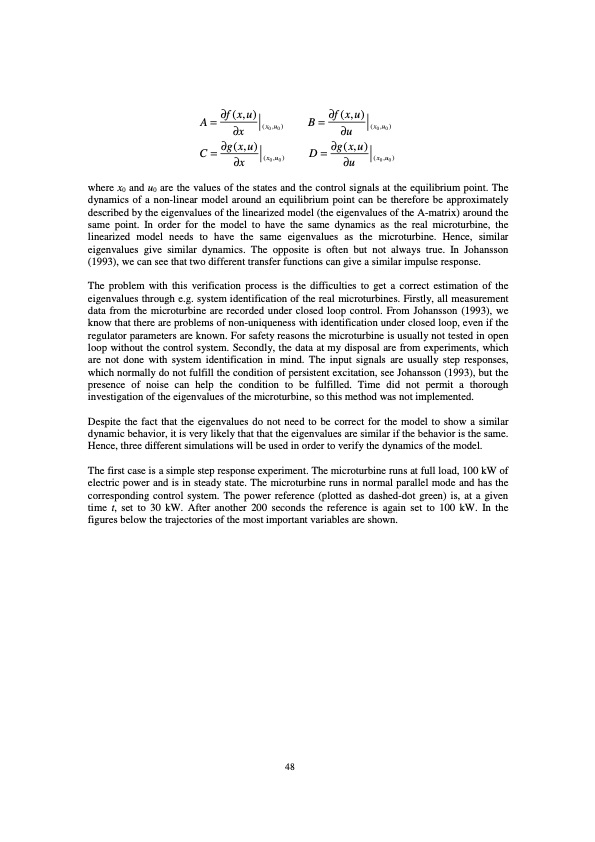
A = ∂f (x,u) ∂x C = ∂g(x,u) ∂x ( x0 ,u0 ) (x0 ,u0 ) B = ∂f (x,u) ∂u ( x0 ,u0 ) D = ∂g(x,u) ∂u (x0 ,u0 ) where x0 and u0 are the values of the states and the control signals at the equilibrium point. The dynamics of a non-linear model around an equilibrium point can be therefore be approximately described by the eigenvalues of the linearized model (the eigenvalues of the A-matrix) around the same point. In order for the model to have the same dynamics as the real microturbine, the linearized model needs to have the same eigenvalues as the microturbine. Hence, similar eigenvalues give similar dynamics. The opposite is often but not always true. In Johansson (1993), we can see that two different transfer functions can give a similar impulse response. The problem with this verification process is the difficulties to get a correct estimation of the eigenvalues through e.g. system identification of the real microturbines. Firstly, all measurement data from the microturbine are recorded under closed loop control. From Johansson (1993), we know that there are problems of non-uniqueness with identification under closed loop, even if the regulator parameters are known. For safety reasons the microturbine is usually not tested in open loop without the control system. Secondly, the data at my disposal are from experiments, which are not done with system identification in mind. The input signals are usually step responses, which normally do not fulfill the condition of persistent excitation, see Johansson (1993), but the presence of noise can help the condition to be fulfilled. Time did not permit a thorough investigation of the eigenvalues of the microturbine, so this method was not implemented. Despite the fact that the eigenvalues do not need to be correct for the model to show a similar dynamic behavior, it is very likely that that the eigenvalues are similar if the behavior is the same. Hence, three different simulations will be used in order to verify the dynamics of the model. The first case is a simple step response experiment. The microturbine runs at full load, 100 kW of electric power and is in steady state. The microturbine runs in normal parallel mode and has the corresponding control system. The power reference (plotted as dashed-dot green) is, at a given time t, set to 30 kW. After another 200 seconds the reference is again set to 100 kW. In the figures below the trajectories of the most important variables are shown. 48PDF Image | Modelling of Microturbine Systems

PDF Search Title:
Modelling of Microturbine SystemsOriginal File Name Searched:
Model_turbiny_T100.pdfDIY PDF Search: Google It | Yahoo | Bing
Capstone Turbine and Microturbine: Capstone microturbines used and new surplus for sale listing More Info
Consulting and Strategy Services: Need help with Capstone Turbine, sizing systems, applications, or renewable energy strategy, we are here to assist More Info
Container Lumber Dry Kiln: Since 1991 developing and innovating dry kilns using standard shipping containers More Info
Supercritical CO2 Lumber Dry Kiln: Compact fast drying in 3 days or less for small amounts of wood and lumber drying More Info
BitCoin Mining: Bitcoin Mining and Cryptocurrency... More Info
Publications: Capstone Turbine publications for microturbine and distributed energy More Info
FileMaker Software for Renewable Energy Developing database software for the renewable energy industry More Info
CO2 Gas to Liquids On-Demand Production Cart Developing a supercritical CO2 to alcohol on-demand production system (via Nafion reverse fuel cell) More Info
Stranded Gas for low cost power Bitcoin Mining Using stranded gas for generators may provide breakthrough low power costs for cryptocurrency miners. More Info
| CONTACT TEL: 608-238-6001 Email: greg@globalmicroturbine.com | RSS | AMP |