PDF Publication Title:
Text from PDF Page: 021
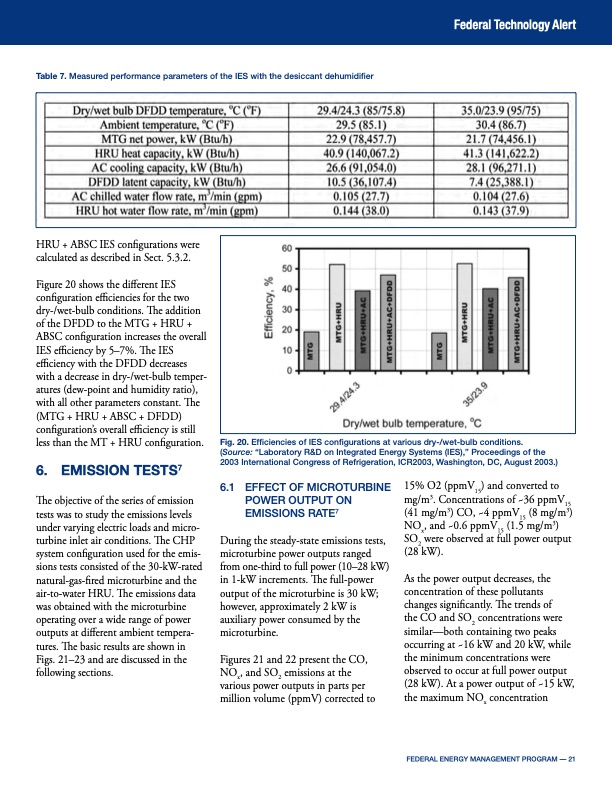
Federal Technology Alert Table 7. Measured performance parameters of the IES with the desiccant dehumidifier HRU + ABSC IES configurations were calculated as described in Sect. 5.3.2. Figure 20 shows the different IES configuration efficiencies for the two dry-/wet-bulb conditions. The addition of the DFDD to the MTG + HRU + ABSC configuration increases the overall IES efficiency by 5–7%. The IES efficiency with the DFDD decreases with a decrease in dry-/wet-bulb temper atures (dew-point and humidity ratio), with all other parameters constant. The (MTG + HRU + ABSC + DFDD) configuration’s overall efficiency is still less than the MT + HRU configuration. 6. EMISSION TESTS7 The objective of the series of emission tests was to study the emissions levels under varying electric loads and micro- turbine inlet air conditions. The CHP system configuration used for the emis sions tests consisted of the 30-kW-rated natural-gas-fired microturbine and the air-to-water HRU. The emissions data was obtained with the microturbine operating over a wide range of power outputs at different ambient tempera tures. The basic results are shown in Figs. 21–23 and are discussed in the following sections. Fig. 20. Efficiencies of IES configurations at various dry-/wet-bulb conditions. (Source: “Laboratory R&D on Integrated Energy Systems (IES),” Proceedings of the 2003 International Congress of Refrigeration, ICR2003, Washington, DC, August 2003.) 6.1 EFFECT OF MICROTURBINE POWER OUTPUT ON EMISSIONS RATE7 During the steady-state emissions tests, microturbine power outputs ranged from one-third to full power (10–28 kW) in 1-kW increments. The full-power output of the microturbine is 30 kW; however, approximately 2 kW is auxiliary power consumed by the microturbine. Figures 21 and 22 present the CO, NOx, and SO2 emissions at the various power outputs in parts per million volume (ppmV) corrected to 15% O2 (ppmV15) and converted to mg/m3. Concentrations of ~36 ppmV15 (41 mg/m3) CO, ~4 ppmV15 (8 mg/m3) NOx, and ~0.6 ppmV15 (1.5 mg/m3) SO2 were observed at full power output (28 kW). As the power output decreases, the concentration of these pollutants changes significantly. The trends of the CO and SO2 concentrations were similar—both containing two peaks occurring at ~16 kW and 20 kW, while the minimum concentrations were observed to occur at full power output (28 kW). At a power output of ~15 kW, the maximum NOx concentration FEDERAL ENERGY MANAGEMENT PROGRAM –– 21PDF Image | Summary of Results from Testing a 30-kW-Microturbine and Combined Heat and Power (CHP) System
PDF Search Title:
Summary of Results from Testing a 30-kW-Microturbine and Combined Heat and Power (CHP) SystemOriginal File Name Searched:
fta_microturbinechp.pdfDIY PDF Search: Google It | Yahoo | Bing
Capstone Turbine and Microturbine: Capstone microturbines used and new surplus for sale listing More Info
Consulting and Strategy Services: Need help with Capstone Turbine, sizing systems, applications, or renewable energy strategy, we are here to assist More Info
Container Lumber Dry Kiln: Since 1991 developing and innovating dry kilns using standard shipping containers More Info
Supercritical CO2 Lumber Dry Kiln: Compact fast drying in 3 days or less for small amounts of wood and lumber drying More Info
BitCoin Mining: Bitcoin Mining and Cryptocurrency... More Info
Publications: Capstone Turbine publications for microturbine and distributed energy More Info
FileMaker Software for Renewable Energy Developing database software for the renewable energy industry More Info
CO2 Gas to Liquids On-Demand Production Cart Developing a supercritical CO2 to alcohol on-demand production system (via Nafion reverse fuel cell) More Info
Stranded Gas for low cost power Bitcoin Mining Using stranded gas for generators may provide breakthrough low power costs for cryptocurrency miners. More Info
| CONTACT TEL: 608-238-6001 Email: greg@globalmicroturbine.com | RSS | AMP |