PDF Publication Title:
Text from PDF Page: 058
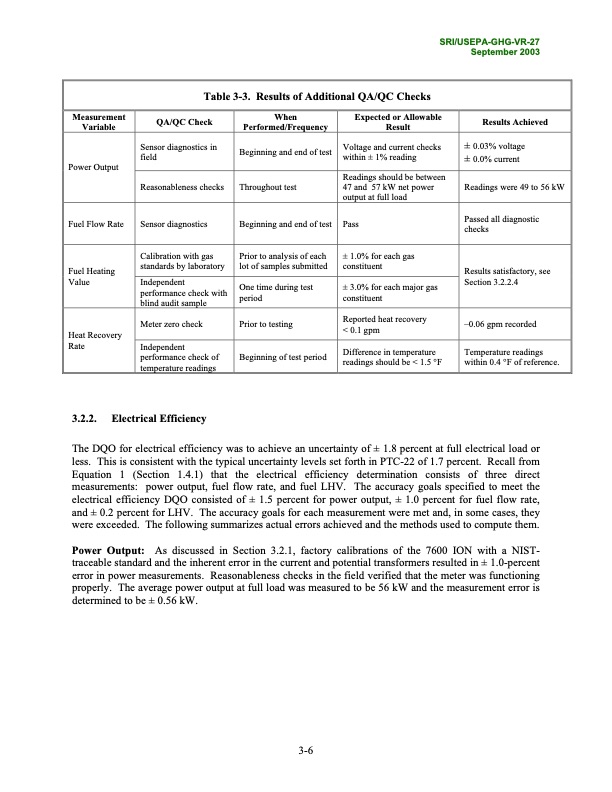
SRI/USEPA-GHG-VR-27 September 2003 Table 3-3. Results of Additional QA/QC Checks Measurement Variable Power Output Fuel Heating Value Heat Recovery Rate QA/QC Check Sensor diagnostics in field Reasonableness checks Calibration with gas standards by laboratory Independent performance check with blind audit sample Meter zero check Independent performance check of temperature readings When Performed/Frequency Beginning and end of test Throughout test Prior to analysis of each lot of samples submitted One time during test period Prior to testing Beginning of test period Expected or Allowable Result Voltage and current checks within ± 1% reading Readings should be between 47 and 57 kW net power output at full load ± 1.0% for each gas constituent ± 3.0% for each major gas constituent Reported heat recovery < 0.1 gpm Difference in temperature readings should be < 1.5 °F Results Achieved ± 0.03% voltage ± 0.0% current Readings were 49 to 56 kW Results satisfactory, see Section 3.2.2.4 –0.06 gpm recorded Temperature readings within 0.4 °F of reference. Fuel Flow Rate Sensor diagnostics Beginning and end of test Pass Passed all diagnostic checks 3.2.2. Electrical Efficiency The DQO for electrical efficiency was to achieve an uncertainty of ± 1.8 percent at full electrical load or less. This is consistent with the typical uncertainty levels set forth in PTC-22 of 1.7 percent. Recall from Equation 1 (Section 1.4.1) that the electrical efficiency determination consists of three direct measurements: power output, fuel flow rate, and fuel LHV. The accuracy goals specified to meet the electrical efficiency DQO consisted of ± 1.5 percent for power output, ± 1.0 percent for fuel flow rate, and ± 0.2 percent for LHV. The accuracy goals for each measurement were met and, in some cases, they were exceeded. The following summarizes actual errors achieved and the methods used to compute them. Power Output: As discussed in Section 3.2.1, factory calibrations of the 7600 ION with a NIST- traceable standard and the inherent error in the current and potential transformers resulted in ± 1.0-percent error in power measurements. Reasonableness checks in the field verified that the meter was functioning properly. The average power output at full load was measured to be 56 kW and the measurement error is determined to be ± 0.56 kW. 3-6PDF Image | Environmental Technology Verification Report
PDF Search Title:
Environmental Technology Verification ReportOriginal File Name Searched:
Capstone-ETV-Report.pdfDIY PDF Search: Google It | Yahoo | Bing
Capstone Turbine and Microturbine: Capstone microturbines used and new surplus for sale listing More Info
Consulting and Strategy Services: Need help with Capstone Turbine, sizing systems, applications, or renewable energy strategy, we are here to assist More Info
Container Lumber Dry Kiln: Since 1991 developing and innovating dry kilns using standard shipping containers More Info
Supercritical CO2 Lumber Dry Kiln: Compact fast drying in 3 days or less for small amounts of wood and lumber drying More Info
BitCoin Mining: Bitcoin Mining and Cryptocurrency... More Info
Publications: Capstone Turbine publications for microturbine and distributed energy More Info
FileMaker Software for Renewable Energy Developing database software for the renewable energy industry More Info
CO2 Gas to Liquids On-Demand Production Cart Developing a supercritical CO2 to alcohol on-demand production system (via Nafion reverse fuel cell) More Info
Stranded Gas for low cost power Bitcoin Mining Using stranded gas for generators may provide breakthrough low power costs for cryptocurrency miners. More Info
| CONTACT TEL: 608-238-6001 Email: greg@globalmicroturbine.com | RSS | AMP |