PDF Publication Title:
Text from PDF Page: 036
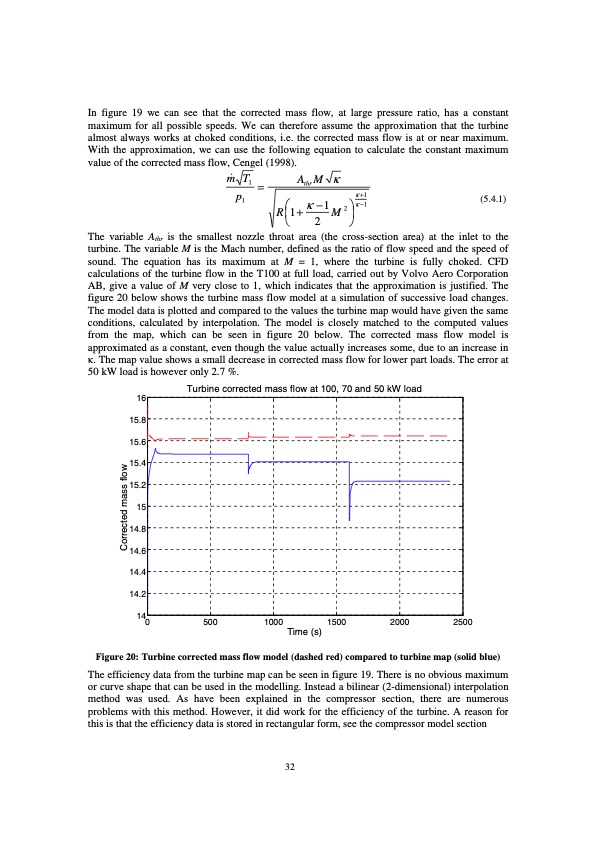
In figure 19 we can see that the corrected mass flow, at large pressure ratio, has a constant maximum for all possible speeds. We can therefore assume the approximation that the turbine almost always works at choked conditions, i.e. the corrected mass flow is at or near maximum. With the approximation, we can use the following equation to calculate the constant maximum value of the corrected mass flow, Cengel (1998). (5.4.1) The variable Athr is the smallest nozzle throat area (the cross-section area) at the inlet to the turbine. The variable M is the Mach number, defined as the ratio of flow speed and the speed of sound. The equation has its maximum at M = 1, where the turbine is fully choked. CFD calculations of the turbine flow in the T100 at full load, carried out by Volvo Aero Corporation AB, give a value of M very close to 1, which indicates that the approximation is justified. The figure 20 below shows the turbine mass flow model at a simulation of successive load changes. The model data is plotted and compared to the values the turbine map would have given the same conditions, calculated by interpolation. The model is closely matched to the computed values from the map, which can be seen in figure 20 below. The corrected mass flow model is approximated as a constant, even though the value actually increases some, due to an increase in κ. The map value shows a small decrease in corrected mass flow for lower part loads. The error at 50 kW load is however only 2.7 %. m& T1 = AthrM κ p1 κ −1 2 κ+1 R1+ M κ−1 2 16 15.8 15.6 15.4 15.2 15 14.8 14.6 14.4 14.2 140 500 1000 1500 2000 2500 Turbine corrected mass flow at 100, 70 and 50 kW load Time (s) Figure 20: Turbine corrected mass flow model (dashed red) compared to turbine map (solid blue) The efficiency data from the turbine map can be seen in figure 19. There is no obvious maximum or curve shape that can be used in the modelling. Instead a bilinear (2-dimensional) interpolation method was used. As have been explained in the compressor section, there are numerous problems with this method. However, it did work for the efficiency of the turbine. A reason for this is that the efficiency data is stored in rectangular form, see the compressor model section 32 Corrected mass flowPDF Image | Modelling of Microturbine Systems
PDF Search Title:
Modelling of Microturbine SystemsOriginal File Name Searched:
Model_turbiny_T100.pdfDIY PDF Search: Google It | Yahoo | Bing
Capstone Turbine and Microturbine: Capstone microturbines used and new surplus for sale listing More Info
Consulting and Strategy Services: Need help with Capstone Turbine, sizing systems, applications, or renewable energy strategy, we are here to assist More Info
Container Lumber Dry Kiln: Since 1991 developing and innovating dry kilns using standard shipping containers More Info
Supercritical CO2 Lumber Dry Kiln: Compact fast drying in 3 days or less for small amounts of wood and lumber drying More Info
BitCoin Mining: Bitcoin Mining and Cryptocurrency... More Info
Publications: Capstone Turbine publications for microturbine and distributed energy More Info
FileMaker Software for Renewable Energy Developing database software for the renewable energy industry More Info
CO2 Gas to Liquids On-Demand Production Cart Developing a supercritical CO2 to alcohol on-demand production system (via Nafion reverse fuel cell) More Info
Stranded Gas for low cost power Bitcoin Mining Using stranded gas for generators may provide breakthrough low power costs for cryptocurrency miners. More Info
| CONTACT TEL: 608-238-6001 Email: greg@globalmicroturbine.com | RSS | AMP |