PDF Publication Title:
Text from PDF Page: 077
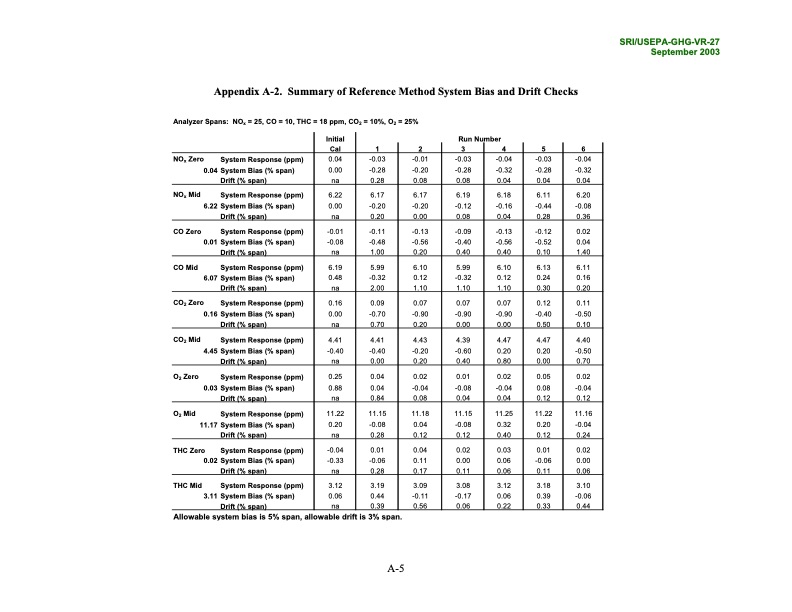
NOx Zero 0.04 System Response (ppm) System Bias (% span) Drift (% span) 0.04 -0.03 -0.01 0.00 -0.28 -0.20 na 0.28 0.08 -0.03 -0.04 -0.03 -0.04 -0.28 -0.32 -0.28 -0.32 0.08 0.04 0.04 0.04 NOx Mid 6.22 System Response (ppm) System Bias (% span) Drift (% span) 6.22 6.17 6.17 0.00 -0.20 -0.20 na 0.20 0.00 6.19 6.18 6.11 6.20 -0.12 -0.16 -0.44 -0.08 0.08 0.04 0.28 0.36 CO Zero 0.01 System Response (ppm) System Bias (% span) Drift (% span) -0.01 -0.11 -0.13 -0.08 -0.48 -0.56 na 1.00 0.20 -0.09 -0.13 -0.12 0.02 -0.40 -0.56 -0.52 0.04 0.40 0.40 0.10 1.40 CO Mid 6.07 System Response (ppm) System Bias (% span) Drift (% span) 6.19 5.99 6.10 0.48 -0.32 0.12 na 2.00 1.10 5.99 6.10 6.13 6.11 -0.32 0.12 0.24 0.16 1.10 1.10 0.30 0.20 CO2 Zero 0.16 System Response (ppm) System Bias (% span) Drift (% span) 0.16 0.09 0.07 0.00 -0.70 -0.90 na 0.70 0.20 0.07 0.07 0.12 0.11 -0.90 -0.90 -0.40 -0.50 0.00 0.00 0.50 0.10 CO2 Mid 4.45 System Response (ppm) System Bias (% span) Drift (% span) 4.41 4.41 4.43 -0.40 -0.40 -0.20 na 0.00 0.20 4.39 4.47 4.47 4.40 -0.60 0.20 0.20 -0.50 0.40 0.80 0.00 0.70 O2 Zero 0.03 System Response (ppm) System Bias (% span) Drift (% span) 0.25 0.04 0.02 0.88 0.04 -0.04 na 0.84 0.08 0.01 0.02 0.05 0.02 -0.08 -0.04 0.08 -0.04 0.04 0.04 0.12 0.12 O2 Mid 11.17 11.15 11.25 11.22 -0.08 0.32 0.20 -0.04 THC Zero 0.02 System Response (ppm) System Bias (% span) Drift (% span) -0.04 0.01 0.04 -0.33 -0.06 0.11 na 0.28 0.17 0.02 0.03 0.01 0.02 0.00 0.06 -0.06 0.00 0.11 0.06 0.11 0.06 THC Mid 3.11 System Response (ppm) System Bias (% span) Drift (% span) 3.12 3.19 3.09 0.06 0.44 -0.11 na 0.39 0.56 3.08 3.12 3.18 3.10 -0.17 0.06 0.39 -0.06 0.06 0.22 0.33 0.44 Appendix A-2. Summary of Reference Method System Bias and Drift Checks AnalyzerSpans: NOx =25,CO=10,THC=18ppm,CO2 =10%,O2 =25% System Response (ppm) System Bias (% span) Drift (% span) 11.22 11.15 11.18 0.20 -0.08 0.04 na 0.28 0.12 11.16 Allowable system bias is 5% span, allowable drift is 3% span. Initial Run Number Cal 1 2 3 4 5 6 A-5 0.12 0.40 0.12 0.24 SRI/USEPA-GHG-VR-27 September 2003PDF Image | Environmental Technology Verification Report
PDF Search Title:
Environmental Technology Verification ReportOriginal File Name Searched:
Capstone-ETV-Report.pdfDIY PDF Search: Google It | Yahoo | Bing
Capstone Turbine and Microturbine: Capstone microturbines used and new surplus for sale listing More Info
Consulting and Strategy Services: Need help with Capstone Turbine, sizing systems, applications, or renewable energy strategy, we are here to assist More Info
Container Lumber Dry Kiln: Since 1991 developing and innovating dry kilns using standard shipping containers More Info
Supercritical CO2 Lumber Dry Kiln: Compact fast drying in 3 days or less for small amounts of wood and lumber drying More Info
BitCoin Mining: Bitcoin Mining and Cryptocurrency... More Info
Publications: Capstone Turbine publications for microturbine and distributed energy More Info
FileMaker Software for Renewable Energy Developing database software for the renewable energy industry More Info
CO2 Gas to Liquids On-Demand Production Cart Developing a supercritical CO2 to alcohol on-demand production system (via Nafion reverse fuel cell) More Info
Stranded Gas for low cost power Bitcoin Mining Using stranded gas for generators may provide breakthrough low power costs for cryptocurrency miners. More Info
| CONTACT TEL: 608-238-6001 Email: greg@globalmicroturbine.com | RSS | AMP |