PDF Publication Title:
Text from PDF Page: 065
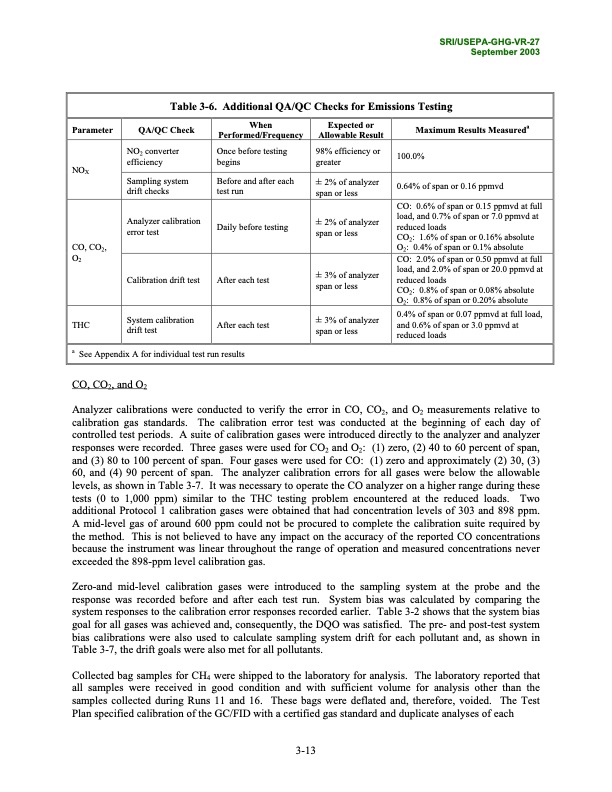
SRI/USEPA-GHG-VR-27 September 2003 Table 3-6. Additional QA/QC Checks for Emissions Testing Parameter NOX QA/QC Check NO2 converter efficiency Sampling system drift checks When Performed/Frequency Once before testing begins Before and after each test run Expected or Allowable Result 98% efficiency or greater ± 2% of analyzer span or less ± 3% of analyzer span or less Maximum Results Measureda 100.0% 0.64% of span or 0.16 ppmvd CO, CO2, O2 Analyzer calibration error test Daily before testing ± 2% of analyzer span or less CO: 0.6% of span or 0.15 ppmvd at full load, and 0.7% of span or 7.0 ppmvd at reduced loads CO2: 1.6% of span or 0.16% absolute O2: 0.4% of span or 0.1% absolute Calibration drift test After each test ± 3% of analyzer span or less CO: 2.0% of span or 0.50 ppmvd at full load, and 2.0% of span or 20.0 ppmvd at reduced loads CO2: 0.8% of span or 0.08% absolute O2: 0.8% of span or 0.20% absolute System calibration drift test 0.4% of span or 0.07 ppmvd at full load, and 0.6% of span or 3.0 ppmvd at reduced loads After each test a See Appendix A for individual test run results CO, CO2, and O2 THC Analyzer calibrations were conducted to verify the error in CO, CO2, and O2 measurements relative to calibration gas standards. The calibration error test was conducted at the beginning of each day of controlled test periods. A suite of calibration gases were introduced directly to the analyzer and analyzer responses were recorded. Three gases were used for CO2 and O2: (1) zero, (2) 40 to 60 percent of span, and (3) 80 to 100 percent of span. Four gases were used for CO: (1) zero and approximately (2) 30, (3) 60, and (4) 90 percent of span. The analyzer calibration errors for all gases were below the allowable levels, as shown in Table 3-7. It was necessary to operate the CO analyzer on a higher range during these tests (0 to 1,000 ppm) similar to the THC testing problem encountered at the reduced loads. Two additional Protocol 1 calibration gases were obtained that had concentration levels of 303 and 898 ppm. A mid-level gas of around 600 ppm could not be procured to complete the calibration suite required by the method. This is not believed to have any impact on the accuracy of the reported CO concentrations because the instrument was linear throughout the range of operation and measured concentrations never exceeded the 898-ppm level calibration gas. Zero-and mid-level calibration gases were introduced to the sampling system at the probe and the response was recorded before and after each test run. System bias was calculated by comparing the system responses to the calibration error responses recorded earlier. Table 3-2 shows that the system bias goal for all gases was achieved and, consequently, the DQO was satisfied. The pre- and post-test system bias calibrations were also used to calculate sampling system drift for each pollutant and, as shown in Table 3-7, the drift goals were also met for all pollutants. Collected bag samples for CH4 were shipped to the laboratory for analysis. The laboratory reported that all samples were received in good condition and with sufficient volume for analysis other than the samples collected during Runs 11 and 16. These bags were deflated and, therefore, voided. The Test Plan specified calibration of the GC/FID with a certified gas standard and duplicate analyses of each 3-13PDF Image | Environmental Technology Verification Report

PDF Search Title:
Environmental Technology Verification ReportOriginal File Name Searched:
Capstone-ETV-Report.pdfDIY PDF Search: Google It | Yahoo | Bing
Capstone Turbine and Microturbine: Capstone microturbines used and new surplus for sale listing More Info
Consulting and Strategy Services: Need help with Capstone Turbine, sizing systems, applications, or renewable energy strategy, we are here to assist More Info
Container Lumber Dry Kiln: Since 1991 developing and innovating dry kilns using standard shipping containers More Info
Supercritical CO2 Lumber Dry Kiln: Compact fast drying in 3 days or less for small amounts of wood and lumber drying More Info
BitCoin Mining: Bitcoin Mining and Cryptocurrency... More Info
Publications: Capstone Turbine publications for microturbine and distributed energy More Info
FileMaker Software for Renewable Energy Developing database software for the renewable energy industry More Info
CO2 Gas to Liquids On-Demand Production Cart Developing a supercritical CO2 to alcohol on-demand production system (via Nafion reverse fuel cell) More Info
Stranded Gas for low cost power Bitcoin Mining Using stranded gas for generators may provide breakthrough low power costs for cryptocurrency miners. More Info
| CONTACT TEL: 608-238-6001 Email: greg@globalmicroturbine.com | RSS | AMP |