PDF Publication Title:
Text from PDF Page: 038
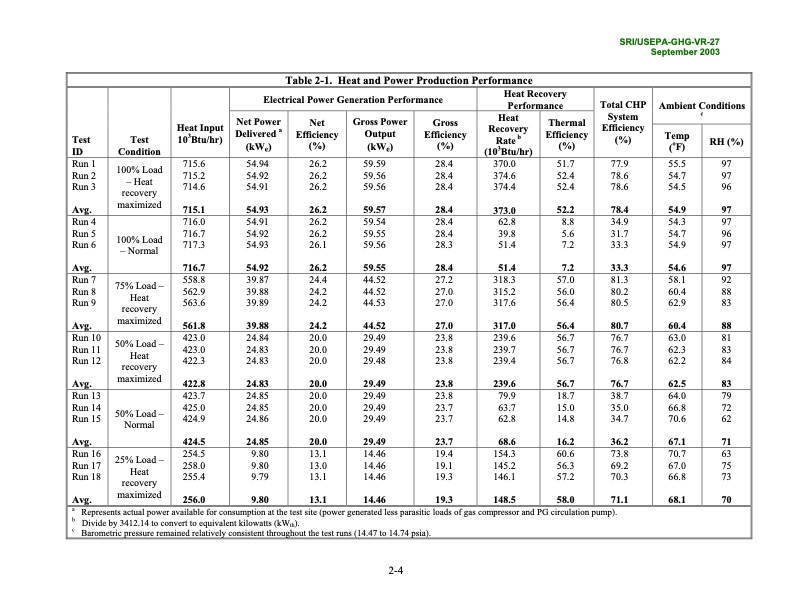
Test Test (103Btu/hr) (%) RH (%) Run 1 Run 2 Run 3 100% Load – Heat recovery maximized 715.6 54.94 26.2 715.2 54.92 26.2 714.6 54.91 26.2 59.59 28.4 59.56 28.4 59.56 28.4 370.0 51.7 374.6 52.4 374.4 52.4 77.9 55.5 78.6 54.7 78.6 54.5 97 97 96 Avg. 715.1 54.93 26.2 59.57 28.4 373.0 52.2 78.4 54.9 97 Run 4 Run 5 Run 6 100% Load – Normal 716.0 54.91 26.2 716.7 54.92 26.2 717.3 54.93 26.1 59.54 28.4 59.55 28.4 59.56 28.3 62.8 8.8 39.8 5.6 51.4 7.2 34.9 54.3 31.7 54.7 33.3 54.9 97 96 97 Avg. 716.7 54.92 26.2 59.55 28.4 51.4 7.2 33.3 54.6 97 Run 7 Run 8 Run 9 75% Load – Heat recovery maximized 558.8 39.87 24.4 562.9 39.88 24.2 563.6 39.89 24.2 44.52 27.2 44.52 27.0 44.53 27.0 318.3 57.0 315.2 56.0 317.6 56.4 81.3 58.1 80.2 60.4 80.5 62.9 92 88 83 Avg. 561.8 39.88 24.2 44.52 27.0 317.0 56.4 80.7 60.4 88 Run 10 Run 11 Run 12 50% Load – Heat recovery maximized 423.0 24.84 20.0 423.0 24.83 20.0 422.3 24.83 20.0 29.49 23.8 29.49 23.8 29.48 23.8 239.6 56.7 239.7 56.7 239.4 56.7 76.7 63.0 76.7 62.3 76.8 62.2 81 83 84 Avg. 422.8 24.83 20.0 29.49 23.8 239.6 56.7 76.7 62.5 83 Run 13 Run 14 Run 15 50% Load – Normal 423.7 24.85 20.0 425.0 24.85 20.0 424.9 24.86 20.0 29.49 23.8 29.49 23.7 29.49 23.7 79.9 18.7 63.7 15.0 62.8 14.8 38.7 64.0 35.0 66.8 34.7 70.6 79 72 62 Avg. 424.5 24.85 20.0 29.49 23.7 68.6 16.2 36.2 67.1 71 Run 16 Run 17 Run 18 25% Load – Heat recovery maximized 254.5 9.80 13.1 258.0 9.80 13.0 255.4 9.79 13.1 14.46 19.4 14.46 19.1 14.46 19.3 154.3 60.6 145.2 56.3 146.1 57.2 73.8 70.7 69.2 67.0 70.3 66.8 63 75 73 Avg. 256.0 9.80 13.1 14.46 19.3 148.5 58.0 71.1 68.1 70 Heat Input Net Power Net Delivered a Efficiency Gross Power Output Gross Efficiency Heat Recovery Rate b Thermal Efficiency (%) Temp (oF) 103Btu/hr) ID Condition (kWe) (%) (kWe) (%) Table 2-1. Heat and Power Production Performance Electrical Power Generation Performance Heat Recovery Performance Total CHP System Efficiency Ambient Conditions c a Represents actual power available for consumption at the test site (power generated less parasitic loads of gas compressor and PG circulation pump). b Divide by 3412.14 to convert to equivalent kilowatts (kWth). c Barometric pressure remained relatively consistent throughout the test runs (14.47 to 14.74 psia). 2-4 SRI/USEPA-GHG-VR-27 September 2003PDF Image | Environmental Technology Verification Report
PDF Search Title:
Environmental Technology Verification ReportOriginal File Name Searched:
Capstone-ETV-Report.pdfDIY PDF Search: Google It | Yahoo | Bing
Capstone Turbine and Microturbine: Capstone microturbines used and new surplus for sale listing More Info
Consulting and Strategy Services: Need help with Capstone Turbine, sizing systems, applications, or renewable energy strategy, we are here to assist More Info
Container Lumber Dry Kiln: Since 1991 developing and innovating dry kilns using standard shipping containers More Info
Supercritical CO2 Lumber Dry Kiln: Compact fast drying in 3 days or less for small amounts of wood and lumber drying More Info
BitCoin Mining: Bitcoin Mining and Cryptocurrency... More Info
Publications: Capstone Turbine publications for microturbine and distributed energy More Info
FileMaker Software for Renewable Energy Developing database software for the renewable energy industry More Info
CO2 Gas to Liquids On-Demand Production Cart Developing a supercritical CO2 to alcohol on-demand production system (via Nafion reverse fuel cell) More Info
Stranded Gas for low cost power Bitcoin Mining Using stranded gas for generators may provide breakthrough low power costs for cryptocurrency miners. More Info
| CONTACT TEL: 608-238-6001 Email: greg@globalmicroturbine.com | RSS | AMP |